How To Measure Website Speed
Website performance is an essential part of running a successful site. If your site takes too long to load, it can deter users from coming back and negatively affect search engine rankings. To get you started on improving your site’s performance, this post will discuss two tools (Page Speed Insights and Lighthouse) that Google provides.
The Measurement Tools
As we tend to rely mostly on Google search for organic traffic, and as site performance and site structure are amongst the ranking factors that Google uses to judge our sites, it makes sense to use testing tools created by Google to highlight speed and structural problems.
As such the Google tools to use are
- Page Speed Insights, and
- Lighthouse
Using Page Speed Insights
You run Page Speed Insights (PSI) by visiting the Page Speed Insights page and entering the URL of the page you wish to test.
Note that PSI measures only one thing. It measures the speed performance of a webpage. You’ll notice that the report you get provides only one number at the top. The aim is to consistently achieve a number in green as shown here.
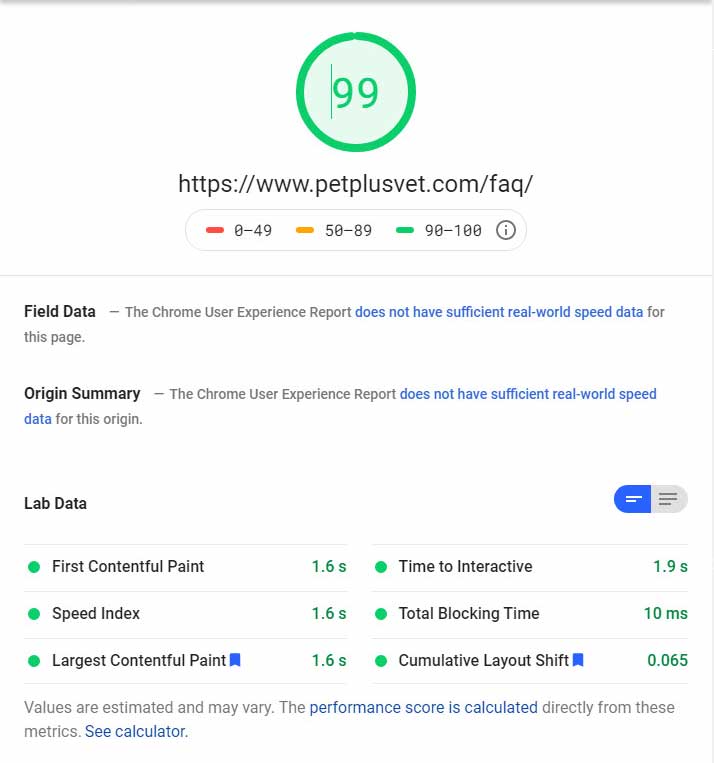
Further down on the Page Speed Insights report, you’ll come across some terms that may not make sense at first glance. Here are the important ones.
- Lab Data – this is the data gathered on the current run of the tool. You will always be provided with Lab Data results.
- Field Data – this is data gathered over the last 28 days from various visitors to the page. Visitors to your website have to be opted in for their data to be included. Not all web pages will have had sufficient visits from participating users, so Field Data will not be available for all web pages.
- Origin Summary – this refers to field data for the whole site – not just the page you are testing. However like Field Data this information may also not be available if your site has had too few visits from qualifying users in the last 28 days. This information is great if you can get it, as it tells you if your whole site has scored well enough to pass the Core Web Vitals assessment.
- Core Web Vitals – this is Google’s name for the group of the most important webpage quality signals out of all the ones that are measured. They have recognised that performance tuning is a complex subject and Web Vitals are an attempt to simplify what a webmaster needs to concentrate on to get the most bang for their buck in terms of doing well with web page optimisation. For more information read about Web Vitals.
Using Lighthouse
There are several ways to run Lighthouse. I like to use the Google Chrome Extension for Lighthouse. Once that is installed you can simply click on the extension to run a web page test on the current page in your browser.
Watch Out For Chrome Extensions
However, if you have loads of Chrome Extensions installed on your browser they will interfere with the results. So you’ll have to run Lighthouse in an incognito window where you typically have no extensions installed.
Of course you will need to make sure Lighthouse is installed in incognito mode but that should be the only extension available in incognito mode. You can do this by right-clicking the extension icon and then clicking on Manage Extensions. Once there, simply slide the Allow in incognito switch to on.
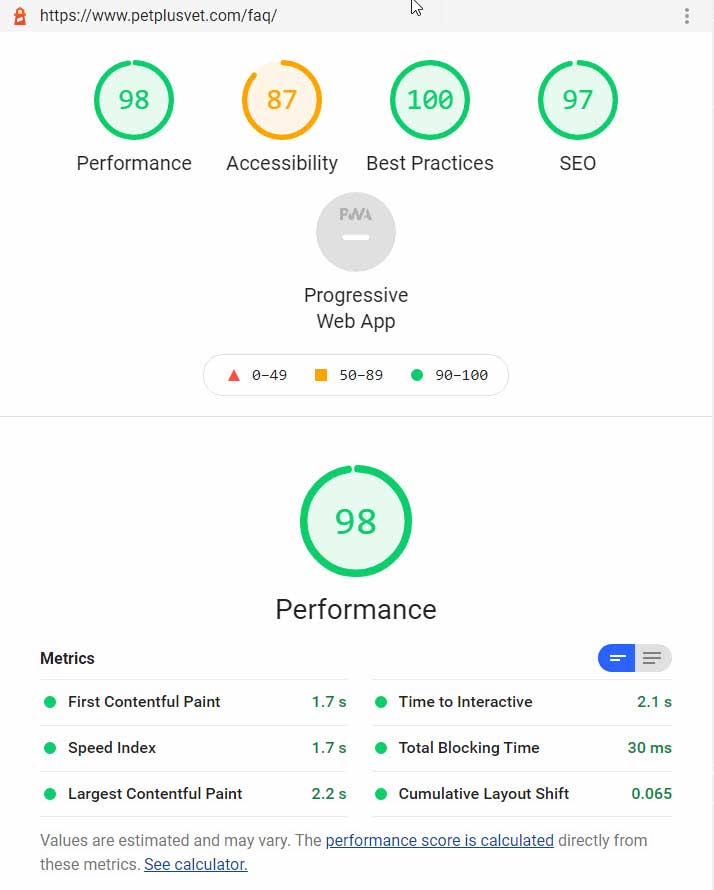
What Does Lighthouse Measure?
Lighthouse measures more than just speed (performance). Altogether it measures
- Performance
- SEO
- Accessibility and
- Best Practices (code health)
The report will show several numbers at the to which give you an overall impression of how well that page has been put together from a Google “web vitals” point of view.
The Lighthouse report uses Google Page Speed Insights to provide the performance information, but doesn’t go into as much depth on the results. If you want the full performance information available, then you must also run Page Speed Insights.
Tools Giving Different Results?
Bear in mind that each time you run either Lighthouse or Page Speed Insights repeatedly, the performance values you see on each run could change. This could be to do with network traffic and server loads which you cannot control.
It is also possible that the version of Page Speed Insights used in Lighthouse may be different to the one used at Page Speed Insights itself. As you can see from the two screenshots above, the performance score was very slightly different. Run each test several times to get a general idea of how well the page is likely to perform.
What About Other Tools Like GTMetrix?
There are a number of popular performance testing tools that now use Lighthouse to power their software. Yet despite using Lighthouse in the background and then presenting the results in their own way, the basic performance results you see on each of these tools may differ considerably. The reason is that each tool uses Lighthouse differently and with different parameters and their tests are run on different hardware. You often get better test results on GTMetrix as they do not throttle the connection.
The best idea is to select a tool you like and stick to it. Personally, I prefer to use Lighthouse as this is a Google tool, and we can only presume they will be using their own tools to analyse our sites and so it makes sense to use what they use.
But How Do You Fix The Problems Revealed?
That’s the subject of another blog post. I’ll update you will a link to it here when it’s done.